









The problem as it presented itself
The customer arrived with a working prototype and a production problem: the LEDs that passed the bench test were not the ones that survived the line. Nothing in the data was out of spec — the failures were spread across batches rather than concentrated in one lot, which ruled out a supplier problem and pointed at the process instead.
Three measurements separated the causes. First, forward voltage at a fixed low current across a sample of each batch, which showed whether the die set was consistent. Second, case temperature under the real drive condition, which showed whether the thermal path matched the assumption in the design. Third, the reflow profile logged on the line, which showed whether the assembly process stayed inside the qualified window.
The first two came back clean. The profile log showed the peak temperature sitting close enough to the limit that normal line-to-line variation pushed parts past it. This is the most common way a qualified component becomes an unqualified assembly, and it is invisible on the datasheet.
- Measure the process, not just the part. A component that meets its specification can still be assembled outside its qualification.
- Log the profile, do not assume it. Reflow profiles drift as boards and fixtures change.
- Look at failure distribution first. Failures spread across batches point at the process; failures concentrated in one batch point at the supply.
Once the profile was corrected and re-qualified, the field return rate dropped to the level the component datasheet predicts. The component never changed — only the process around it.
PCR Optical System Design
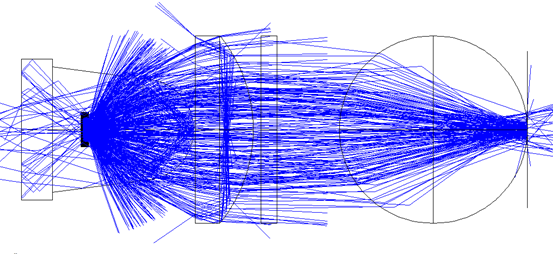
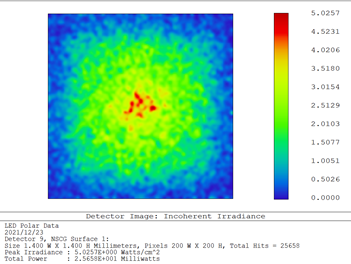
PCR instruments require precise optical systems for fluorescence detection. Our through-hole LEDs with optimized emission wavelengths support real-time PCR and digital PCR applications with high signal-to-noise ratios.
LED Parameter Specifications
Our PCR-grade LEDs feature narrow spectral bandwidths (50mW), and viewing angle (15°-30°).
Through-Hole LED Options
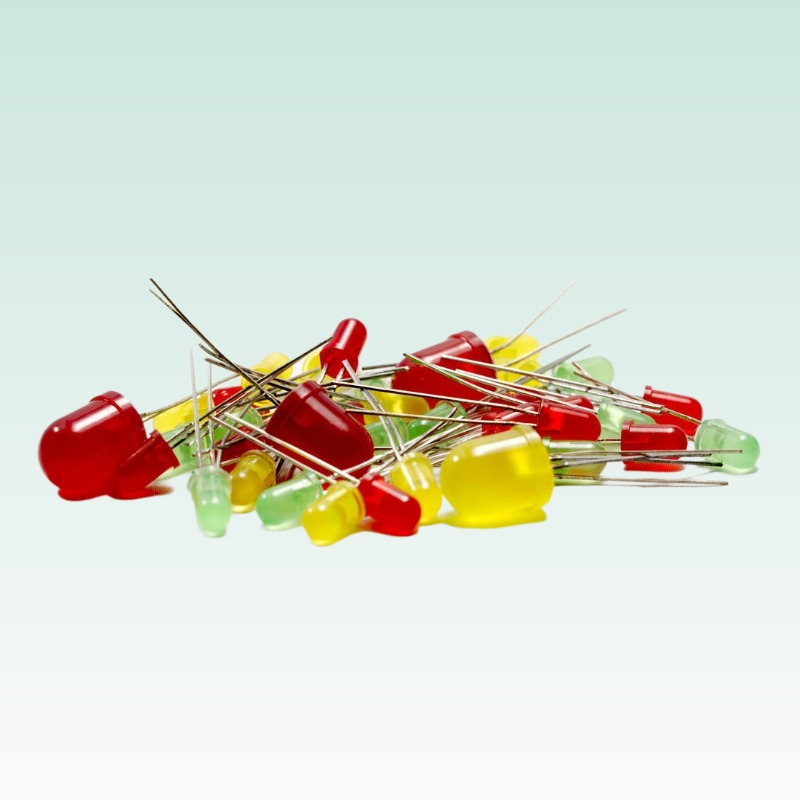
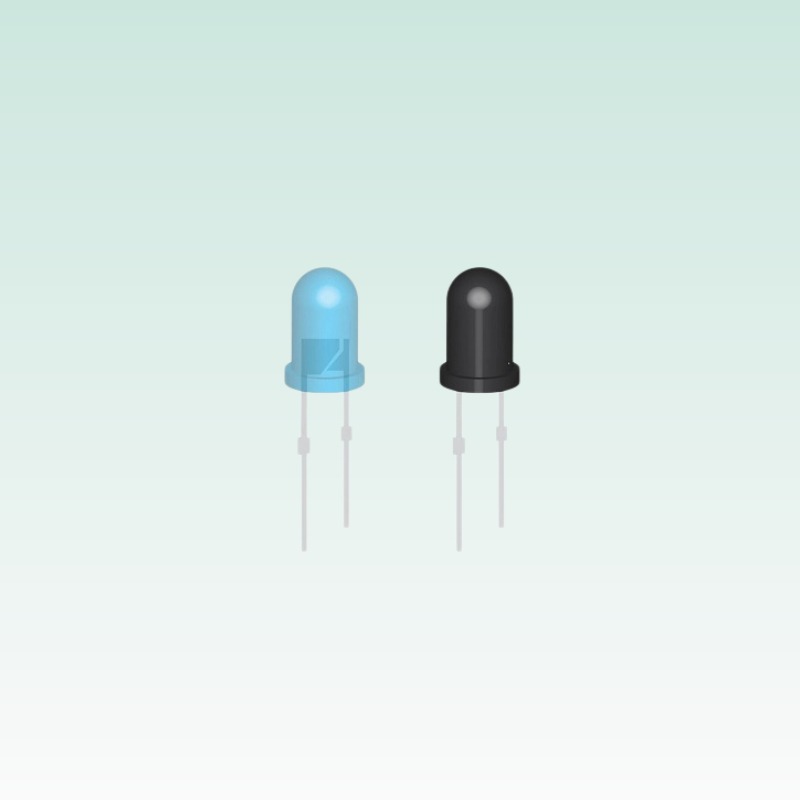
Available in 3mm, 5mm, 8mm, and 10mm packages, our through-hole LEDs for PCR instruments offer excellent optical coupling with fiber systems. The round top design ensures uniform light distribution for multi-well plate illumination.
Application Guidelines
Our engineering team provides custom LED solutions for PCR instrument manufacturers. From UV LEDs for sterilization to high-power LEDs for illumination, we support your optical system requirements.
Excitation Spectrum Matching
PCR LED wavelength optimization for SYBR Green and TaqMan probes.
Thermal Stability
LED junction temperature control for continuous PCR cycling.
Intensity Calibration
Standardized LED output measurement for quantitative fluorescence.