






The problem as it presented itself
The customer arrived with a working prototype and a production problem: the LEDs that passed the bench test were not the ones that survived the line. Nothing in the data was out of spec — the failures were spread across batches rather than concentrated in one lot, which ruled out a supplier problem and pointed at the process instead.
Three measurements separated the causes. First, forward voltage at a fixed low current across a sample of each batch, which showed whether the die set was consistent. Second, case temperature under the real drive condition, which showed whether the thermal path matched the assumption in the design. Third, the reflow profile logged on the line, which showed whether the assembly process stayed inside the qualified window.
The first two came back clean. The profile log showed the peak temperature sitting close enough to the limit that normal line-to-line variation pushed parts past it. This is the most common way a qualified component becomes an unqualified assembly, and it is invisible on the datasheet.
- Measure the process, not just the part. A component that meets its specification can still be assembled outside its qualification.
- Log the profile, do not assume it. Reflow profiles drift as boards and fixtures change.
- Look at failure distribution first. Failures spread across batches point at the process; failures concentrated in one batch point at the supply.
Once the profile was corrected and re-qualified, the field return rate dropped to the level the component datasheet predicts. The component never changed — only the process around it.
A Dutch greenhouse cultivating tomatoes year-round faced challenges with supplemental lighting during winter. Traditional HPS lamps consumed 1,000W per fixture, generated excessive heat, and lacked spectral optimization.
Queendom Solution
Queendom deployed COB-660/450 horticulture LED grow lights delivering targeted 660nm deep red and 450nm blue peaks matching chlorophyll absorption. The system achieved 2.8 umol/J PPE, 60% energy reduction vs HPS.
Key Advantages:
- COB-660/450: Dual-peak matching chlorophyll absorption
- PPE: 2.8 umol/J (60% more efficient than HPS)
- PPFD: 800-2,000 umol/m2/s at canopy
- Spectral tuning for vegetative vs flowering stages
- IP65 housing: Resistant to 90%+ humidity

Product Specifications
| Parameter | Specification |
|---|---|
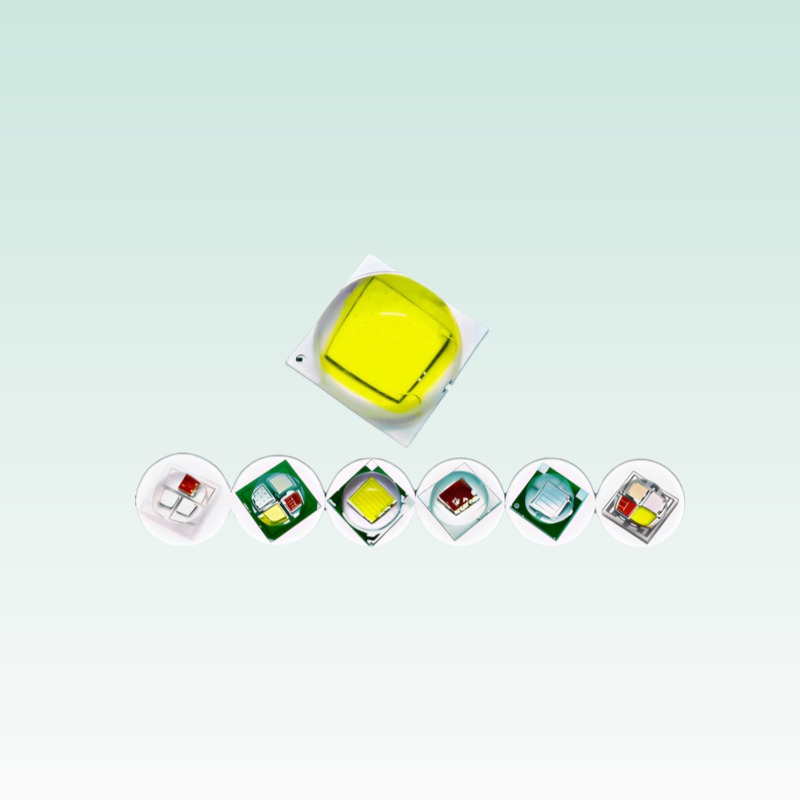
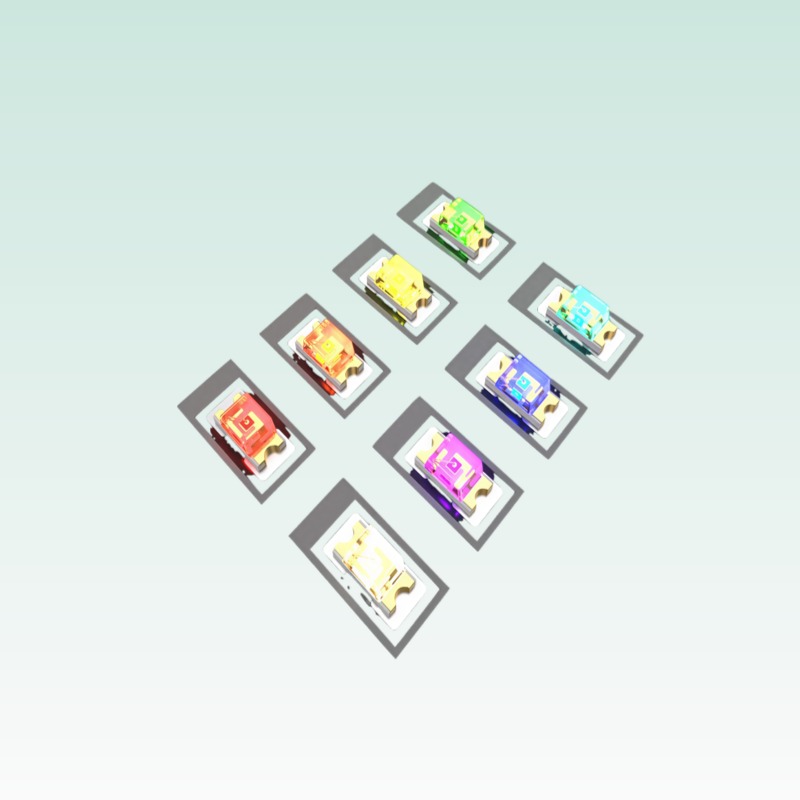
| LED Package | SMD 2835 / 3535 / 3030 (multi-chip array) |
| PPE (Efficacy) | 2.6 – 3.0 umol/J |
| PPFD at Canopy | 600 – 1,200 umol/m2/s |
| Spectrum | 660nm deep red + 450nm blue + 730nm far red (full spectrum) |
| Chip Count per Fixture | 2835: 200pcs / 3030: 120pcs / 3535: 80pcs |
| Fixture Power | 100W – 600W (replaces 250W – 1,000W HPS) |
| Lifespan (L70) | 50,000+ hours |
| Certifications | CE / RoHS / DLC / ETL |
Application Scenarios
Tomato Greenhouse
1,000 fixtures, +18% yield, 40% energy savings
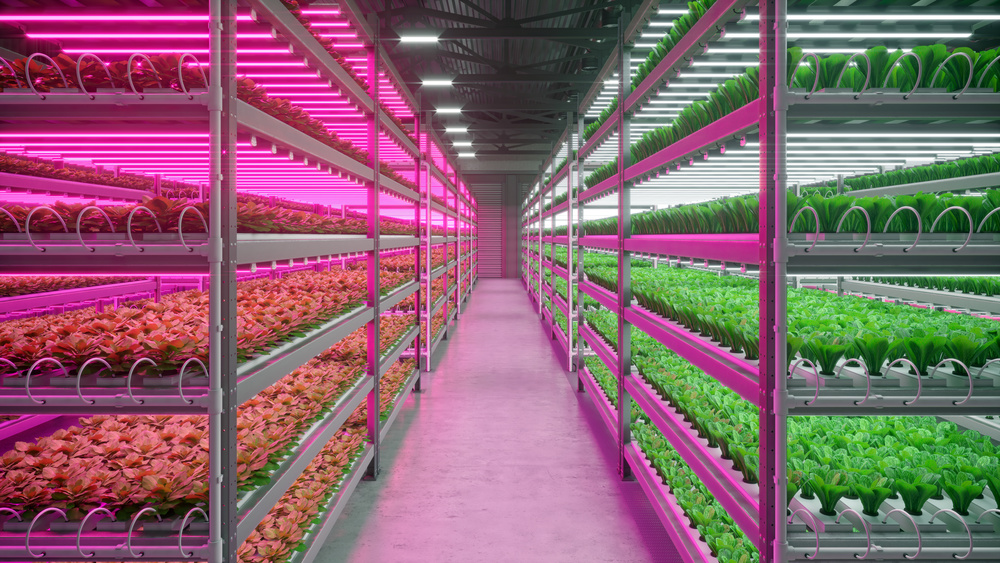
Vertical Farm Lettuce
200 fixtures, 12-day harvest cycle
Cannabis Flowering
Spectral tuning red-heavy for flowering
Case Direction
Greenhouse project: COB grow lights with 660nm/450nm spectrum, yield increase 18%, 60% energy reduction vs HPS.
Related Links
Solution: Horticulture LEDs Solutions
Product: LED Diodes & Chips
Case Studies: High Power LED Case | LED Optical System Case
Discover how Queendom LED solutions can transform your application.
Contact Us